Smart marketers constantly tinker with their segmentation strategy, working tediously to ensure that the right message is reaching the right people at the right time. With the rise of so many platforms across the vast social media landscape, this has never been more important—or more challenging. The opportunity certainly is ripe for reaching new audiences, but to do so, you first need to understand where certain groups are clustering.
To that end, as you work through your own social media segmentation strategy, we’ve taken a deep dive into the demographics of each of the major platforms. The goal is to empower you to better align your brand’s efforts with the social conversations that matter most, while making lasting, meaningful connections with core groups of brand loyalists.
To get started, jump right to the data you need by clicking on any of the anchor links below.
A note about our sources: Each section list where the information was pulled, but a special thanks goes to the folks at the Pew Research Center, whose
social media study has proved invaluable.
First, Pull Your Own Social Demographics
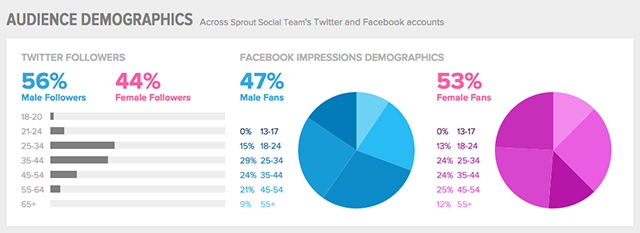
A great way to see exactly which demographic you should target on social is to look at the demographic makeup of your current follower-base. When you start a
free trial of Sprout Social, we’ll start to pull in gender, age and location data from some of your social audiences.
This data shows the types of people who currently follow you on social, which is a good indication of your ideal social audience. Pair your personal data with the demographic data we’ve compiled here to hone your brand’s social media segmentation strategy.
With
1.44 billion monthly active users, Facebook is the market leader for social networking sites. Your brand undoubtedly has a presence there, but how can you be using it in new ways to reach different groups?
Source: This data is based on the Pew report as well as the self-reported information from over 1 billion Facebook profiles of users over the age of 18 pulled from the FacebookAudience Insights Tool.
There have been rumblings that Facebook is losing some traction among a younger audience, causing it to skew a bit older. While
this trend may be true, Facebook’s youthful base remains strong.
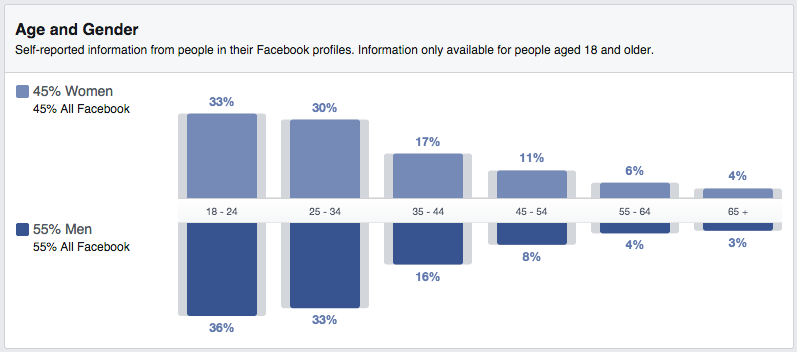
In fact, Facebook data shows that the 18–24 age range is still the biggest demographic using the site.
- 87% of adults 18–29 use Facebook.
- 73% of adults 30–49 use Facebook.
- 63% of adults 50–64 use Facebook.
- 56% of adults 65+ use Facebook.
Facebook also seems to skew more heavily toward women, with 77% of adult females on the site and 66% adult males.
This is one of the most important statistics that companies should consider, since there’s not a huge advantage in creating a presence on a social network who only has users in countries you can’t service.
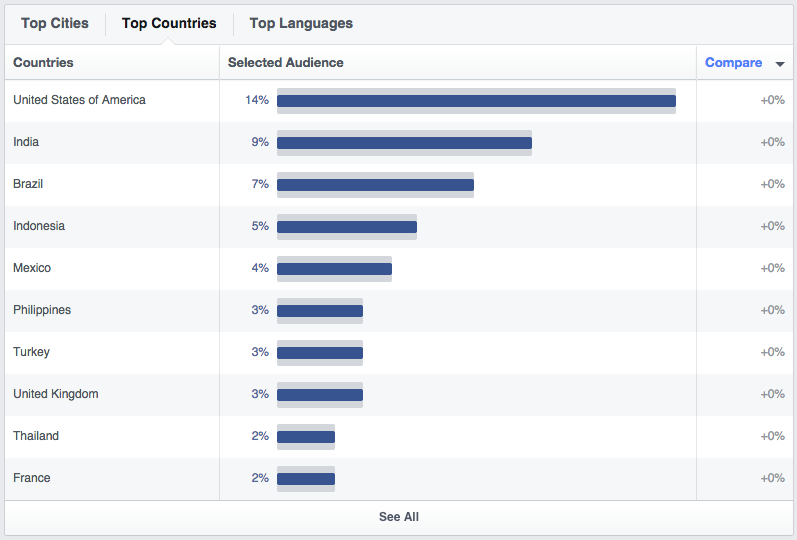
- United States: 14% of the Facebook audience
- India: 9% of the Facebook audience
- Brazil: 7% of the Facebook audience
- Indonesia: 5% of the Facebook audience
- Mexico: 4% of the Facebook audience
Also, of those living in the United States, here is a breakdown of the percentage of adults using Facebook by region:
- 72% of adults living in the suburbs use Facebook.
- 71% of adults living in urban areas use Facebook.
- 69% of adults living in rural areas use Facebook.
As Facebook was originally created for college students, it makes sense that adults who have graduated from college are the leading demographic.
- 74% of adults who went to college use Facebook.
- 71% of adults with some college experience use Facebook.
- 70% of adults who graduated high school or less use Facebook.
One important thing to consider is the income level of your various segment targets. For instance, luxury goods are more likely to resonate with higher income earners.
- 77% of adults who make less than $30,000 use Facebook.
- 74% of adults who make between $50,000-$74,999 use Facebook.
- 72% of adults who make over $75,000 use Facebook.
- 69% of adults who make between $30,000–$49,000 use Facebook.
Facebook is unique in that it has a tool that allows you to play with audience data to find trends and statistics. For the rest of the networks, we turned to more external resources.
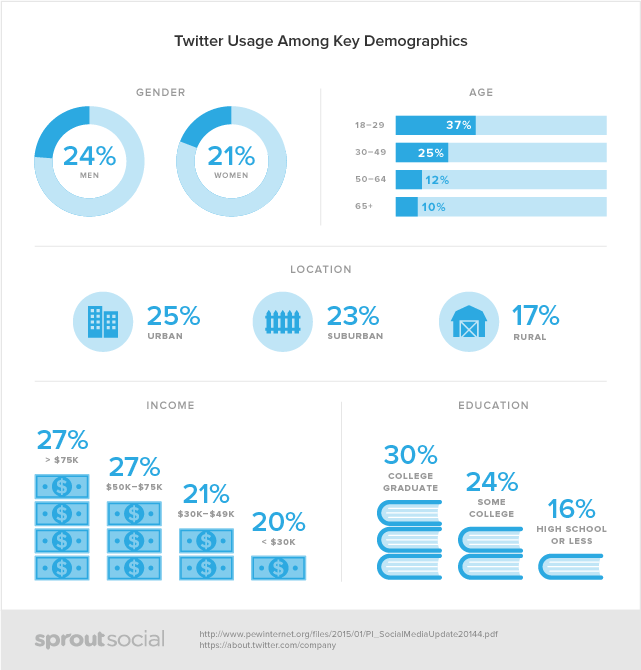
Source: Twitter data is based off page 6 of the Pew Research Center Demographics of Key Social Networking Platforms study and information from Twitter’s About Page.
Considering the high-volume, fast-paced nature of Twitter, you might expect of a younger demographic. If so, you’re not completely off the mark. Here are the Twitter age demographics, according to Pew:
- 37% of adults 18–29 use Twitter.
- 25% of adults 30–49 use Twitter.
- 12% of adults 50–64 use Twitter.
- 10% of adults 65+ use Twitter.
Meanwhile, here are the gender demographics from that same study:
- 24% of adult men use Twitter.
- 21% of adult women use Twitter.
Based on this data, Twitter is a great place if your target audience skews toward a younger crowd. Moreover, for companies who do gender-based targeting, it should be noted that the number of male users has increased a good deal more than the number of female users over the previous year.
According to Twitter, 77% of accounts lie outside the US, with the site supporting 33 languages. Meanwhile, Pew shows that:
- 25% of adults in urban areas use Twitter.
- 23% of adults in suburban areas use Twitter.
- 17% of adults in rural areas use Twitter.
Similar to Facebook, Twitter’s largest audience is the college crowd. Of the online adults that use Twitter, here is a breakdown of their education level:
- 30% have graduated college.
- 24% have some college experience.
- 16% are high school grads or less.
The largest increase from 2013 to 2014 was among college graduates, which makes sense as Twitter seems to be moving toward a more business-friendly platform.
Whether your product or service is a necessity or a discretionary good, a person’s level of income may determine if they can afford it. Here’s how Twitter’s audience is broken down:
- 27% of adults who make over $75,000
- 27% of adults who make $50,000–$74,999
- 21% of adults who make $30,000–$49,999
- 20% of adults who make less than $30,000
Boasting a community of
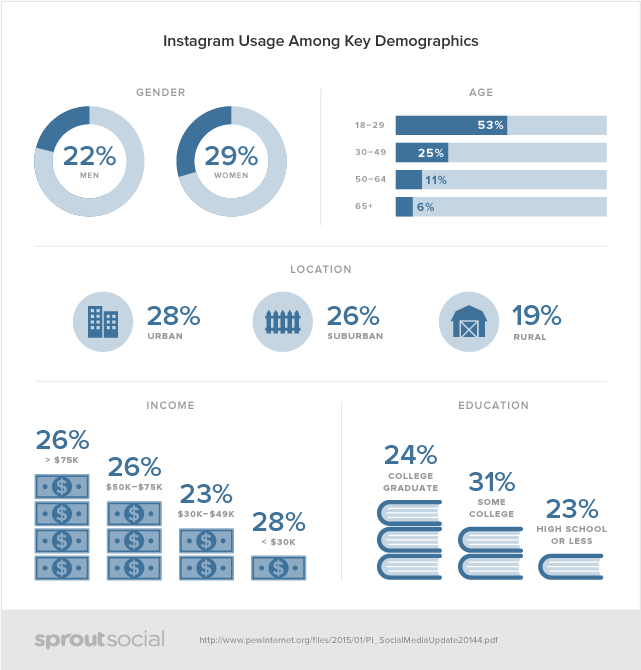
over 300 million users sharing over 60 million photos every day, Instagram is one of the rising stars of social media. The rapid growth in this user base makes it an increasingly popular network for brands. Let’s dive in to see if your target audience is on the site.
Source: This data is based off page 7 of the Pew Research Center Demographics of Key Social Networking Platforms study.
Instagram has overtaken Facebook and Twitter as the network with the largest population of younger users. Here’s the breakdown of the percentage of online adults who use Instagram by age:
- 53% of 18–29 year olds use Instagram.
- 25% of 30–49 year olds use Instagram.
- 11% of 50–64 year olds use Instagram.
- 6% of people 65+ use Instagram.
Also, of all of those age groups, the dominant gender on the photo-sharing site is female.
- 29% of online females use Instagram.
- 22% of online males use Instagram.
It would make sense that the most popular locations for Instagram users are beautiful, photo-worthy locations. Here’s a breakdown of online adults using Instagram based off location:
- 28% of Instagram users live in urban areas.
- 26% of Instagram users live in suburban areas.
- 19% of Instagram users live in rural areas.
This is the first network that we’ve tackled so far in this post that didn’t see college graduates as the top education demographic.
- 31% of Instagram users have some college experience.
- 24% of Instagram users are college graduates.
- 23% of Instagram users are high school grads or less.
It looks as though the majority of Instagram users are current college students, which should make finding pictures from your alma mater much easier.
When it comes to the income of Instagram users, it seems to be in line with many of the other networks.
- 28% of adults making less than $30,000
- 26% of adults making over $75,000
- 26% of adults making $50,000–$74,999
- 23% of adults making $30,000–$49,999
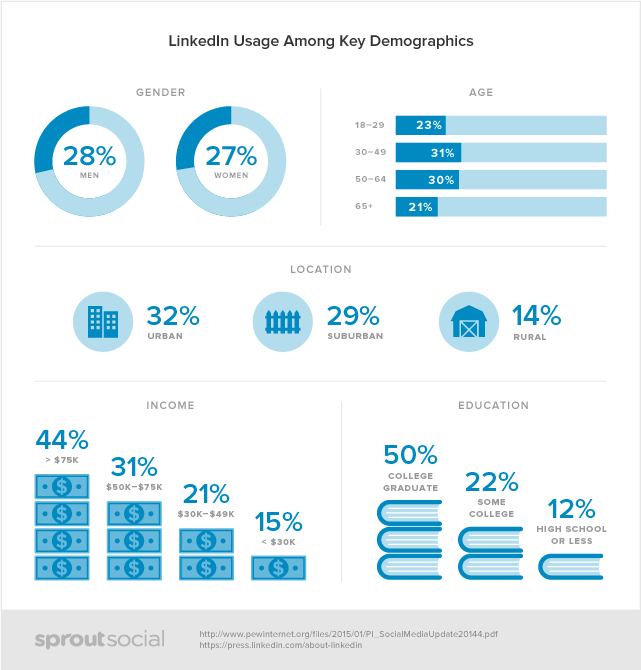
The social media network for professionals has seen some massive growth since its official launch in May of 2003. According to LinkedIn, there are more than 347 million members in over 200 countries and territories in its network. The higher average income of users and working mindset of the network make it an ideal social network for businesses.
Source: This data is based off page 9 of the Pew Research Center Demographics of Key Social Networking Platforms study and from the LinkedIn Press Page.
This is the first social network where the majority of users don’t fall between the 18–29 year old category.
- 31% of adults 30–49 use LinkedIn.
- 30% of adults 50–64 use LinkedIn.
- 23% of adults 18–29 use LinkedIn.
- 21% of adults over 65 use LinkedIn.
There is a pretty close divide when it comes to the different genders using LinkedIn.
- 28% of online men use LinkedIn.
- 27% of online women use LinkedIn.
LinkedIn has also posted an entire map of their users on the press page. Here’s a smaller copy for quick reference:
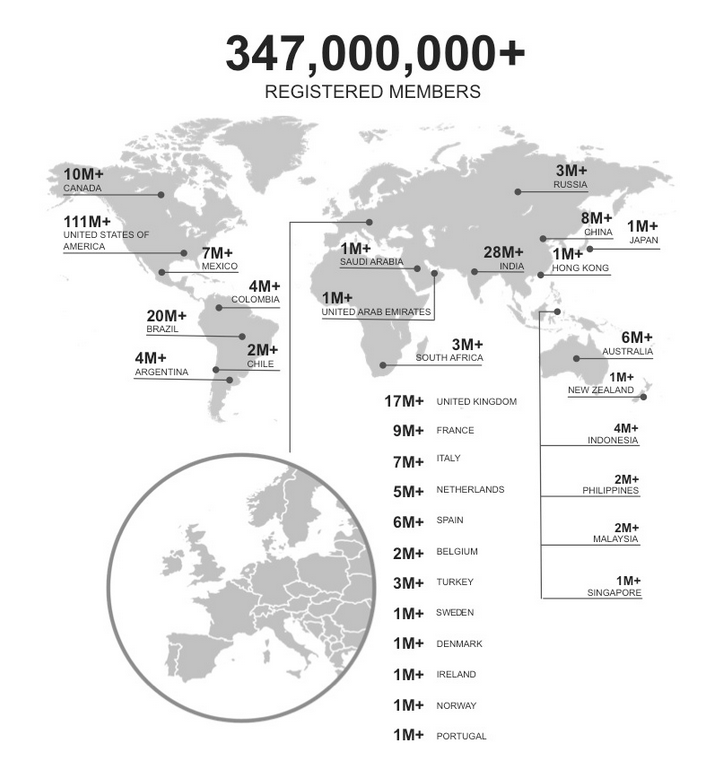
Their regional membership includes:
- 111M+ users in the United States
- 84M+ users in Europe
- 64M+ users in Asia and the Pacific
- 48M+ users in Latin America
We’ve also broken down the United States members by the following areas:
- 32% of adults in urban areas use LinkedIn.
- 29% of adults in suburban areas use LinkedIn.
- 14% of adults in rural areas use LinkedIn.
According to LinkedIn, the fastest growing demographics in its network are students and recent college graduates, making up over 39 million users.
- 50% of adult college graduates use LinkedIn.
- 22% of adults with some college experience use LinkedIn.
- 12% of adults with high school or less experience use LinkedIn.
Perhaps due to the higher education levels of the LinkedIn audience, there is also a higher level of users making a more sizable income.
- 44% of adults making over $75,000 use LinkedIn
- 31% of adults making $50,000–$74,999 use LinkedIn
- 21% of adults making $30,000–$49,999 use LinkedIn
- 15% of adults making less than $30,000 use LinkedIn
In recent years, Pinterest has become a fantastic resource for businesses. If you’re still unsure, just check out all of the
success stories on the Pinterest for Business page. To see if the platform makes sense for your segmentation strategies, consider its demographic breakdown.
Source: This data is based off page 8 of the Pew Research Center Demographics of Key Social Networking Platforms study.
The wide majority of Pinterest users are female, according to Pew:
- 42% of online women use Pinterest.
- 13% of online men use Pinterest.
The network also skews toward a younger demographic:
- 34% of adults 18–29 years old use Pinterest.
- 28% of adults 30–49 years old use Pinterest.
- 27% of adults 50–64 years old use Pinterest.
- 17% of adults 65 and over use Pinterest.
This is the first time in the demographic research that we’ve seen the rural market beat out both the urban and the suburban areas for share of users.
- 30% of adults in rural areas use Pinterest.
- 29% of adults in suburban areas use Pinterest.
- 25% of adults in urban areas use Pinterest.
Like most of the social networks that we have addressed so far in this guide, Pinterest users are more likely to attend or have attended college.
- 32% of adult college graduates use Pinterest.
- 30% of adults with some college experience use Pinterest.
- 22% of adults with at least some high school experience use Pinterest.
Pinterest users tend to have more disposable income. So if your product is more of a leisure good, this is a smart network for your brand.
- 34% of adults making over $75,000 use Pinterest.
- 30% of adults making $50,000–$74,999 use Pinterest.
- 28% of adults making $30,000–$49,999 use Pinterest.
- 22% of adults making less than $30,000 use Pinterest.
Demographics for Google+ are somewhat elusive. Even still, the site has great potential for SEO value, so if the information below doesn’t compel you to create a page, check out this article on
why your brand should be active on Google+.
Source: This information was pulled from a report from the website Statistic Brain.

There’s not much information on the age of Google+ users, but the site has pulled in some statistics on gender distribution.
- 73.7% of Google+ users are male.
- 26.3% of Google+ users are female.
Based on the size of this disparity, it’s likely that there has been a shift since the data was collected.
The United States has the lion’s share of Google+ users.
- 55% of users are from the United States.
- 18% of users are from India.
- 6% of users are from Brazil.
- 5% of users are from the United Kingdom.
- 4% of users are from Canada.
Snapchat is one of the newest social networks to hit the scene, but you wouldn’t know that based on the usage. Back in 2013, CEO Evan Spiegel said that Snapchat now shares
400 million snaps each day, a number that is sure to have increased in that time. Unfortunately, numbers on Snapchat demographics are slim. But we were able to find this tweet from BI Intelligence that succinctly summarizes some good data points.

This section was written after the rest of the article so that we had a better idea of how each network sized up to the others. Let’s first take a look at the use of social media cross the entire online adult population.
- 58% of adults use Facebook.
- 23% of adults use LinkedIn.
- 22% of adults use Pinterest.
- 21% of adults use Instagram.
- 19% of adults use Twitter.
This is pretty telling that, no matter what you’re selling, you’re likely to find new audiences on Facebook. As for the rest of the networks, you’ll need to drill deeper into this data to see what is a good fit.
It’s important to bear in mind that just because someone uses one network, doesn’t mean that they wont use another. In fact, more than ever, people are starting to use multiple social media networks instead of sticking to just one.
- 24% of adults are on two social sites.
- 16% of adults are on three social sites.
- 8% of adults are on four social sites.
- 4% of adults are on five social sites.
Not only does the use of different social networks vary, but the frequency with which people use these networks varies as well.
- 70% of adults use Facebook daily.
- 49% of adults use Instagram daily.
- 36% of adults use Twitter daily.
- 17% of adults use Pinterest daily.
- 13% of adults use LinkedIn daily.
In a perfect world, your brand would create a presence on every single social network available and drill into segmentation further for each. Depending on your resources, that may not be feasible, so choose your networks wisely, and make the most of them once there.
Round out that strategy with a social media tool like
Sprout Social, and you will be headed toward lasting success.
Infographic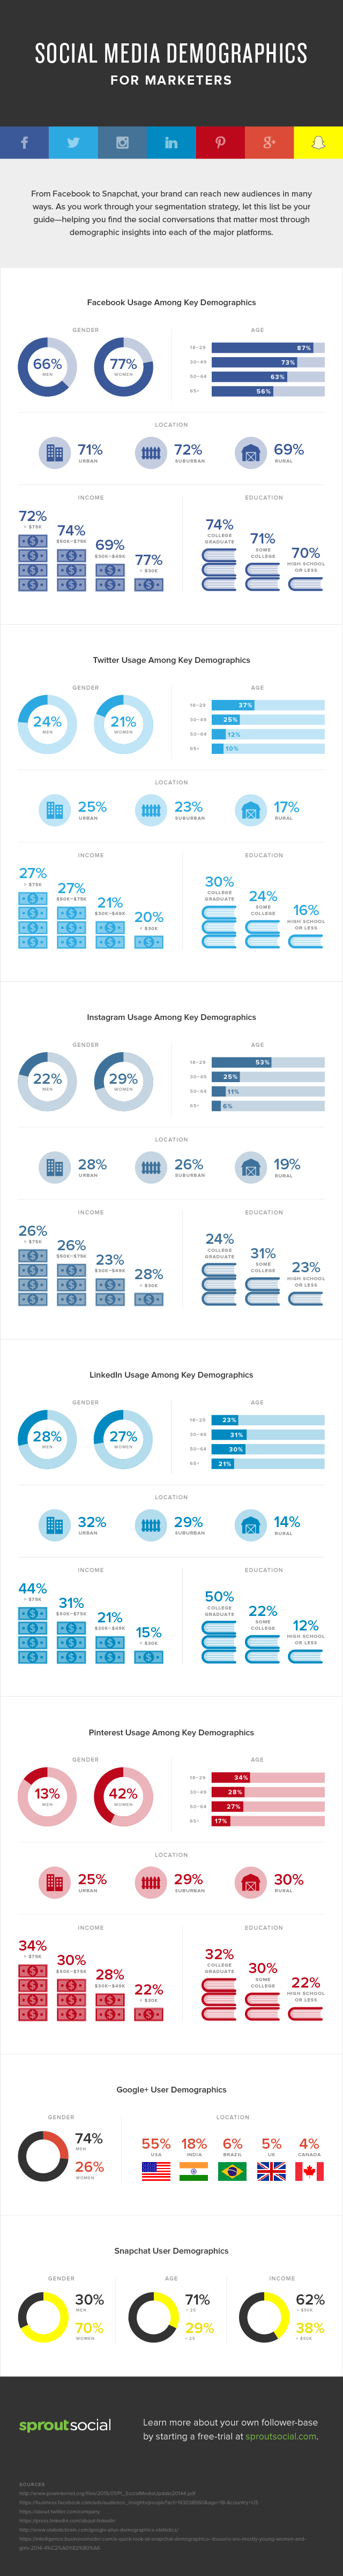


inShare