
 Wouldn't it be great if you could create an infographic as quickly as a regular ole text-based blog post? Unfortunately, the reality is that visual content like this usually takes a lot more time, effort, and let's face it -- skill -- than the written word. Usually.
But considering the popularity and effectiveness of visual content in today's modern marketing world, you can't just afford to throw in the towel. That's why we decided to take all the pain and suffering out of infographic creation. Seriously -- don't throw in the towel just yet. You, too, can create professional-looking, high-quality infographics ... quickly! And I'm going to prove it.
We've got 5 free infographic templates -- all easily customizable in PowerPoint for you to use. All you have to do is bring the content to use inside them. Easy as that! In fact, I'm going to show you just how easy it is by taking one of these PPT templates pictured below and create my own customized infographic with it. Then I'll explain exactly what I did so you get a sense of how easy it is. Let's begin!

How to Create an Infographic in an Hour or Less
Step 1: Gather Your Content/Data
This is the data/content you'll be populating your infographic with. You can either collect third-party data, or use your own original data. If you use third-party data, just be sure you cite your sources -- just like in any other good piece of content.
To keep your infographic uncluttered by a ton of different source URLs, a great way to do this is to include a simple URL at the bottom of your infographic that links to a page on your site listing the individual stats and their sources -- such as the blog post you're using to publish your infographic. This way, your infographic looks clean and professional, yet people will still be able to access the sources no matter where the infographic gets shared or embedded. It may also even drive visitors back to your site!
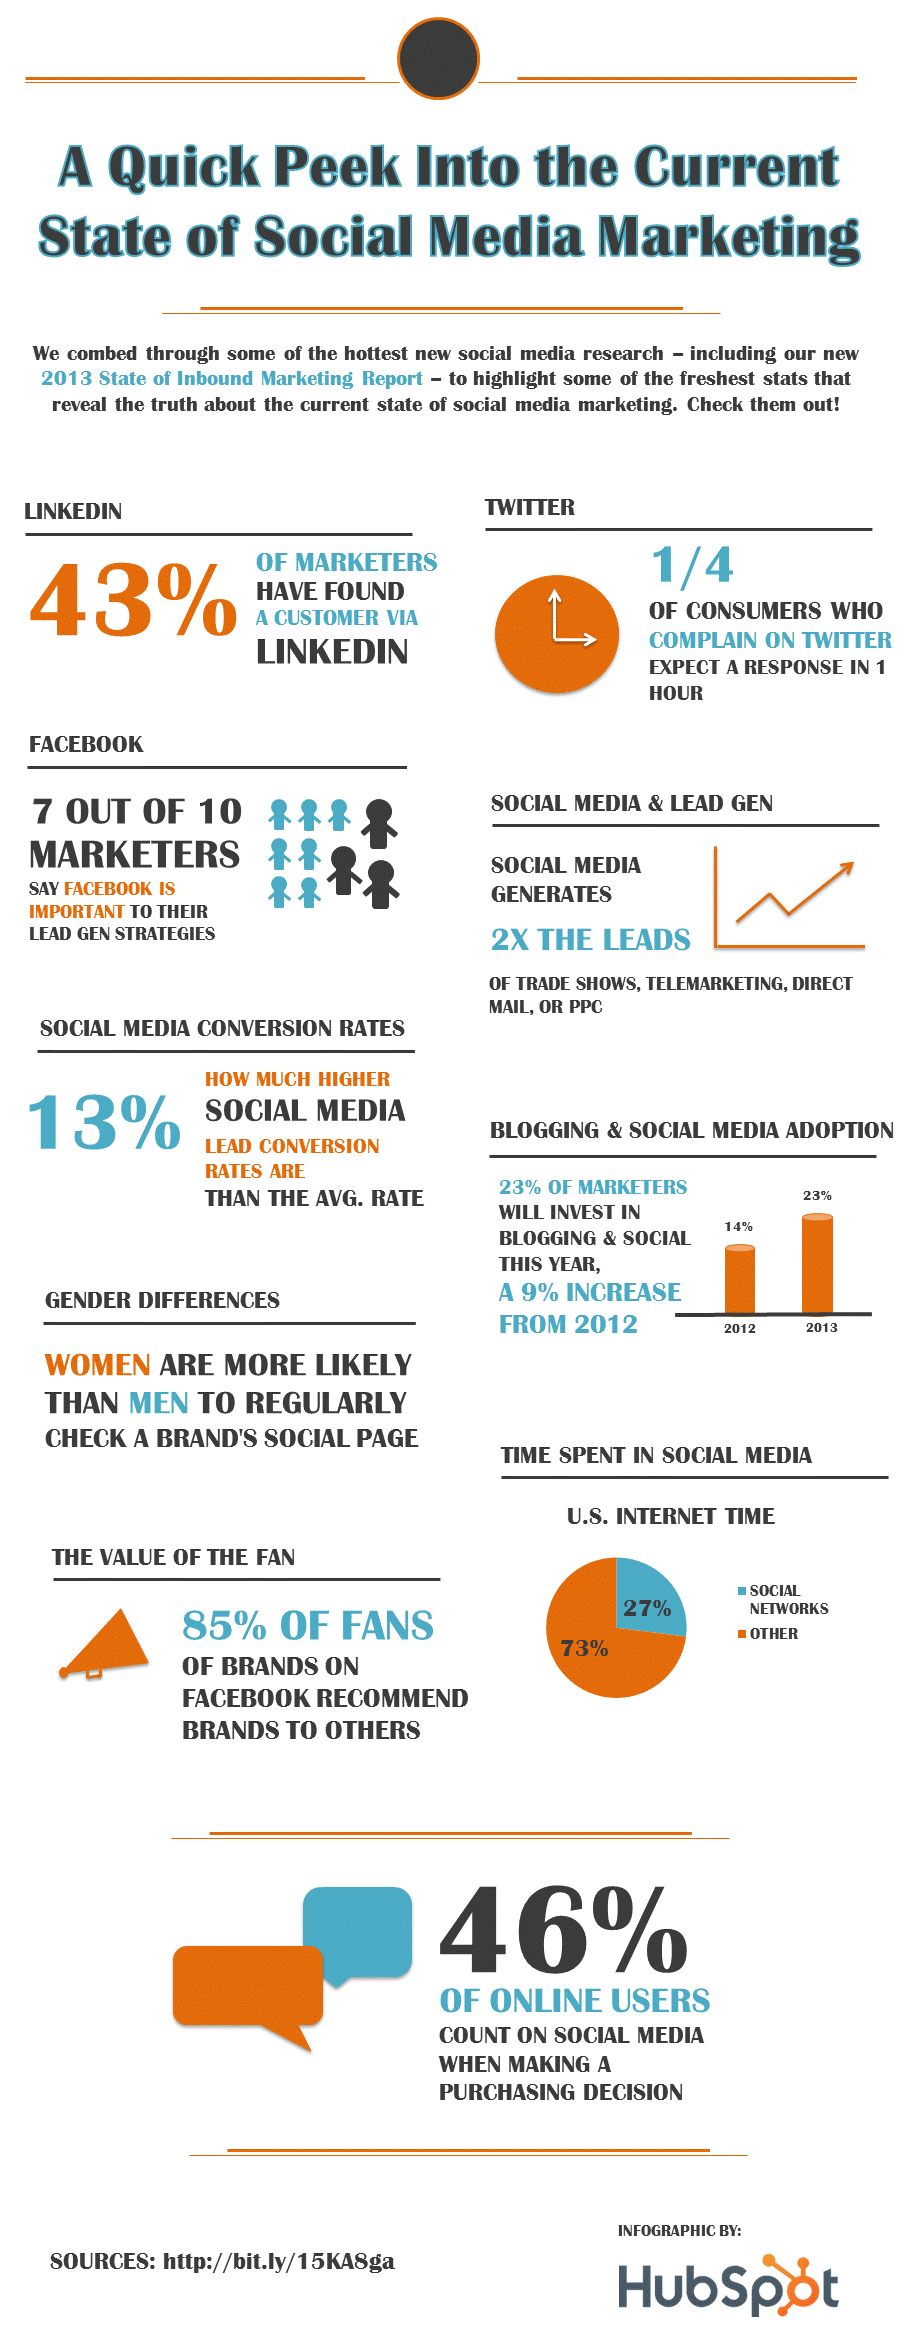
For the sake of time (our mission is to create an infographic in under an hour after all!), for my infographic, I'm going to choose a compilation of stats we've already aggregated in a previous blog post: "
Step 2: Choose Your Desired Template
Your next step is to choose the template you want. As you saw pictured above, we have five infographic templates in PowerPoint for you to choose from: one for creating a four-color infographic, one to convey statistics using alternating font sizes, one to create a data-comparison infographic, one for creating a Pinterest-inspired tiled infographic, and one pretty basic, free-form option.
The important thing here is to choose a template that works for the data/content you want to present. In the case of my 18 social media stats, I'm going to pick the second template option, which conveys statistics using alternating font sizes. The template is pictured below:

Step 3: Customize Your Infographic
Obviously, this is the most time-consuming part -- but it's also the most fun! Simply choose a title, plug in your content, and adjust your font sizes and formatting. Feel free to switch up the graphics, too, so they're relevant to the data you're citing. All I did was use the simple shapes provided by PowerPoint to create things like the clock, the megaphone, and the talk bubbles. I used PowerPoint's charts feature to add the pie chart. (Note: Our free infographic templates download also provides a cheat sheet for using PowerPoint's various features and tools in case you need to brush up on your PPT skills.)
To customize the look of the infographic a bit more, I also added a third color to the mix -- orange -- to give the infographic more of a HubSpotty, branded feel. And if I wanted to, I could've changed up the font style as well.
Finally, I included a shortened link to my list of sources, which can be found on our website at http://bit.ly/15KA8ga, as well as the HubSpot logo so people know who created the infographic if it gets shared in social media or embedded on other websites.
That's it! The whole thing took me less than an hour to put together -- much shorter than it would've taken me if I'd started from scratch (not to mention more professional looking ... and cheaper than hiring a designer). Here it is!

Share this Image On Your Site
Step 4: Publish It!
The only thing left to do is to promote your awesome new infographic. As I mentioned earlier, we recommend using your blog to publish it (including your list of sources), as well as providing aPin It button for visitors to share it on Pinterest and an embed code for visitors to share it on their own websites, as we did above. Check out this blog post to learn how to easily create an infographic embed code.