Monday, September 16, 2019

How to Run an Empathy & User Journey Mapping Workshop

Harry Brignull
Jan 4, 2016 · 6 min read

Introduction

This article will teach you two popular design workshop techniques: empathy mapping and user journey mapping. Empathy mapping is a way to characterise your target users in order to make effective design decisions. User journey mapping is a way to deconstruct a user’s experience with a product or service as a series of steps and themes. Put simply, these methods encourage your stakeholders to think about user needs effectively, identifying pain points and opportunities in a systematic and straightforward way.
To make things interesting, I’m going to explain the methods in the context of a fictional case study. Let’s imagine it’s 2004 and we’re a hardware company called Pure Digital looking to get into the digital video camera market. We’re just starting to work on a new type of camera that will later be named “The Flip” (If you’re old enough you’ll remember it was a really big deal in the days before the iPhone). At the time, other manufacturers were making bulky camcorders while The Flip ended up being small, plasticky and about ¼ of the price, managing to dominate the market through a superior user experience. In a way, it set the tone for many of the video sharing features you have on your smartphone today.

Empathy Mapping

A blank empathy map template. Download it here.
An empathy map is a very quick, very rough persona template (Gray et al, 2010). It’s not much different to any other ad-hoc persona template — it’s really just a tool to articulate what you know about a particular type of user— their needs, goals, expectations, behaviours, pain points, and so on.
Once you’ve created an empathy map, you then use it as a tool for design decision making. In other words, you role-play as the persona and say to yourselves “What would this persona think when they see this?” or “What unanswered questions would prevent them from proceeding to the next step?”and so on.
Ideally all personas should be based on solid research findings, but this isn’t always possible. At the beginning of a project (during the discovery phaseor exploration phase) you’ll have no research to draw upon, but you will have a room full of project stakeholders. They probably already have some fairly clear hypotheses about their customer segments and the key defining characteristics of each type. Empathy maps will help your stakeholders externalise their knowledge in a form that assists with design decision-making. You can then treat your empathy maps as hypotheses for any formal user research that comes later in the project.
Anyway, let’s get back to our Pure Digital case study. The idea is that we’d get a group of stakeholders in a room, and get them to identify their main user types (there’s usually a few user types for any product or service, but for the sake of this article we’ll talk about just one). You then give them the template, some Sharpies and Post-its, then have them fill it in. You’ll notice that a post-it could go into one quadrant or another depending on the way you word it. Don’t worry about this — it’s not science, it’s just a way to get stuff out of their heads and onto paper as quickly as possible. Here’s what they create, below:
Our hypothetical empathy map showing Charlie, our target user.
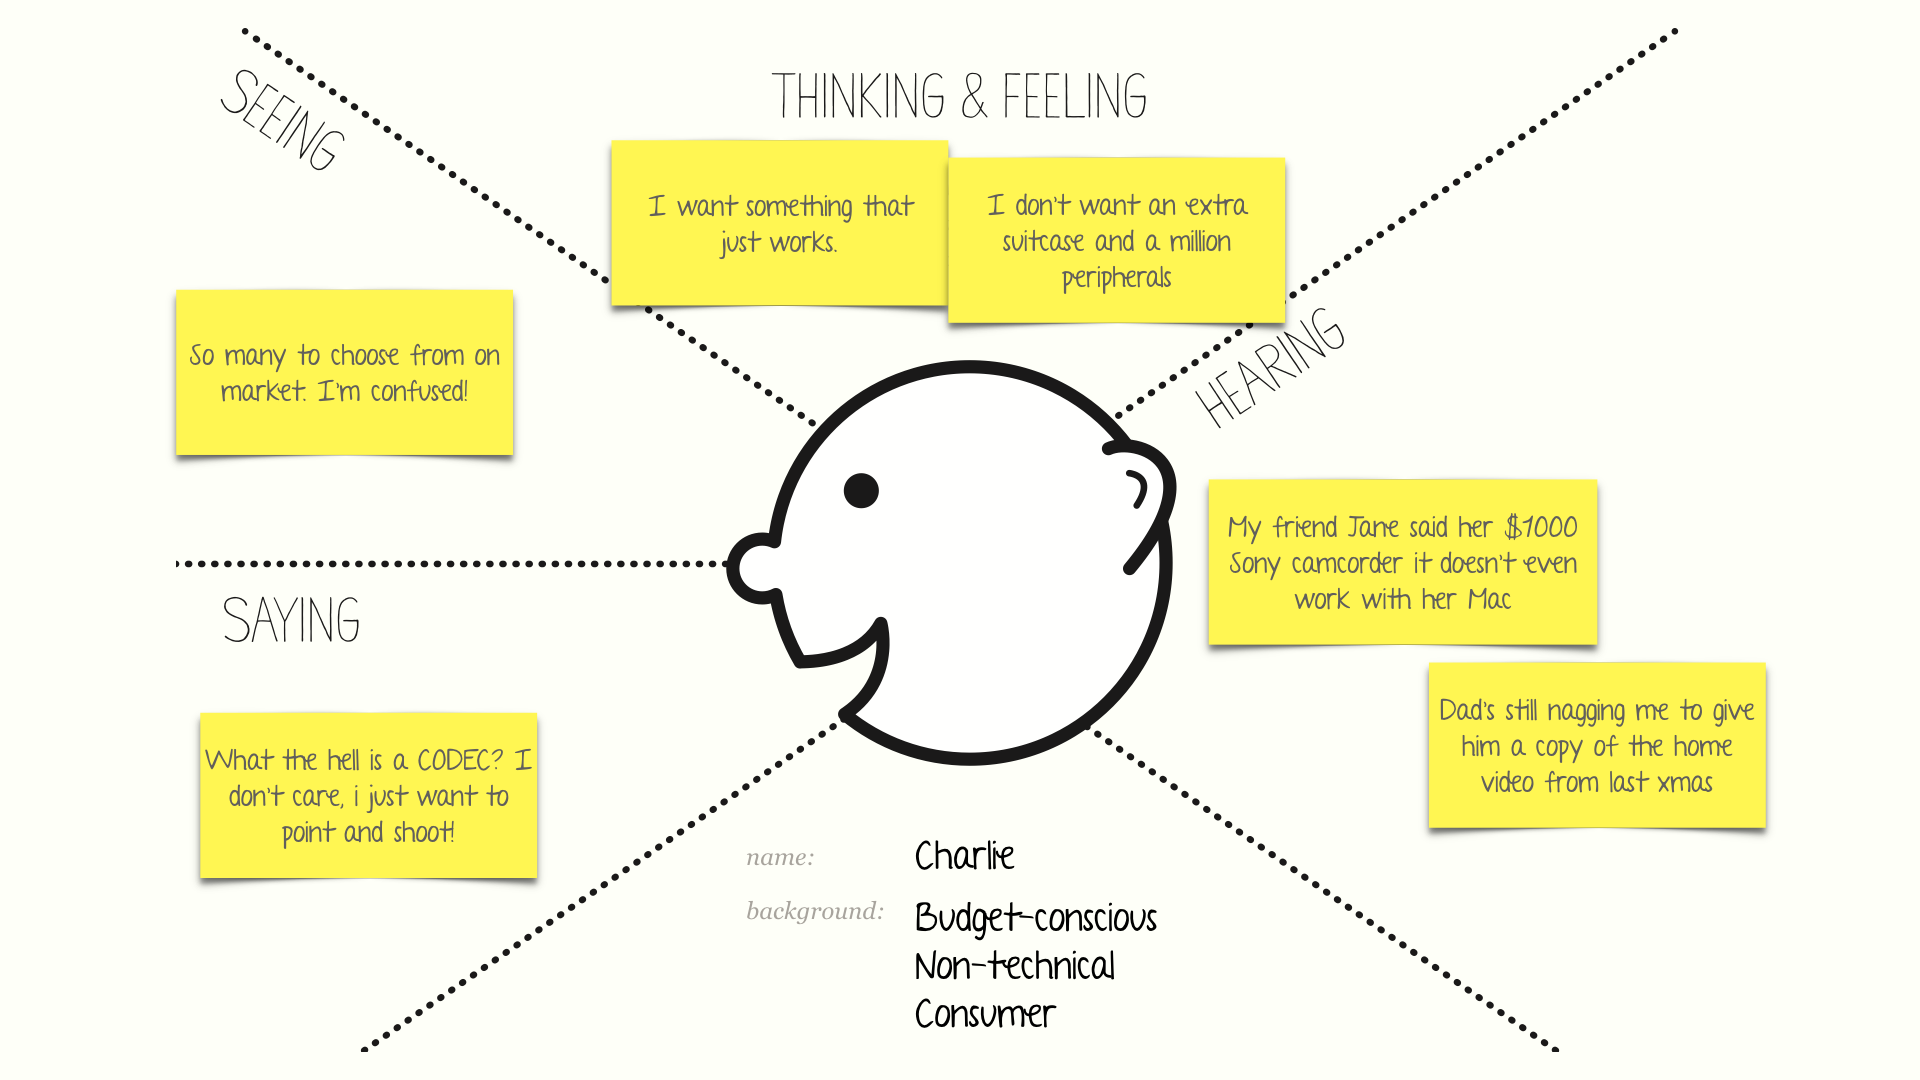
As you can see in the diagram above, our target user is experiencing a lot of annoyances with the way products enable him to record and share video. She doesn’t care about codecs or spare battery packs. She doesn’t want to spend weeks choosing the perfect camera. She wants something that “just works”. Remember, we’re imagining this design exercise is being done 2004: pre-iPhone and pre-YouTube.

User Journey Mapping

Now we’ll take our insights about Charlie and apply them to an experience that the’ve had. There are two types of user journey map: retrospective maps: where you map out how users currently do stuff (typically based on research findings); and prospective maps: where you map how you expect users to behave with a new product idea. In this article we’ll be doing a retrospective map.
A user journey map is really just a big table with steps through time on the horizontal axis, and themes for analysis on the vertical axis. Either find a clean wall or get big foamcore board, and use masking tape to create a big grid. The steps on the horizontal axis will vary according to the problem you’re working on, but the vertical axis usually stays the same.
A simple user journey map framework
As a group, you now work together to fill in the grid. it’s best to start left-to-right top-to-bottom, regularly referencing the empathy map as a source of inspiration. Don’t worry if there are some blank cells, this is normal.
Actions: the thing the user needs to do to move to the next step
Questions: things the user needs answering before they’ll be willing to move to the next step
Happy moments: positive, enjoyable things that improve the experience
Pain points: frustrations and annoyances that spoil the experience
Opportunities: design enhancements that you could implement in a new product, that address any of the problems identified.
This is what our finished user journey map looks like:
A user journey map showing Charlie’s experience creating and sharing digital video in the mid 2000s.
It’s important to leave the “Opportunities” row until last. It’s basically a summary of the problems you’ve identified (i.e. unanswered questions and pain points), re-conceived as design opportunities.
Opportunities derived from the User Journey Mapping exercise

What comes next

Having done the workshop, you’ve gained the following things:
  • Participants have learned about user centred decision-making
  • They’ve started to think in terms of users and journeys, not specs and features
  • You’ve identified some potential opportunities for the product roadmap
That said, it’s important not to get carried away. A User Journey Map workshop doesn’t magically allow you to skip through the design process. It gives you a good starting point. It’s normal to spend a few weeks in the discovery and exploration phases, understanding your target users through research, exploring design concepts, iterating and throwing a lot of bad ideas away before a line of code gets written.
One final piece of advice: if you do an image search for User Journey Mapsyou’ll see lots of very elaborate posters. These are often made by design agencies to justify their fees — don’t bother doing this unless you’re certain it’ll bring value to your team. Your time may better be spent designing a prototype rather than a poster. Also, if you’ve done your maps based on assumptions, an elaborate poster creates a false sense of validity which is very dangerous. Instead, you should use your assumptive map as a straw man, and initiate some proper user research to find out whether the hypotheses stand up to reality (e.g. qualitative interviews, usability tests, field studies, surveys, and so on).
If you want to chat, drop me a line: harry@brignull.com. To read more of my articles, check out 90percentofeverything.com

6 SEO Trends Of 2019 That You Should Know About

Brandlitic

Stories, Insights, & ideas to help you and your business grow together!

Wednesday, August 21, 2019

The 4C’s of the Marketing Mix


Rewriting the marketing rulebook

Atif M.
Jul 18 · 5 min read
Traditional marketing tactics dictate that organizations follow the 4P’s model of the marketing mix which is a more business-oriented model, as opposed to a customer-oriented one, consisting of the following variables: product, price, promotion, and place.
Modern marketing tactics, on the other hand, follow the 4C’s model of the marketing mix as proposed by Bob Lauterborn in an article written for Advertising Age back in 1990. Lauterborn declared that the 4P’s were no longer relevant and helpful in aiding today’s marketer address any real issues. Instead, he transformed the 4P’s in the variables he believed were vital.
He started with ‘consumer wants and needs’ as the primary focus of any organization’s marketing strategy. Next, he used the variable of ‘cost to satisfy’ to debunk price as the deciding factor in customers’ purchases. Following that was the third variable, convenience to buy, a vital concept in today’s world of 24/7 availability. The often neglected variable, i.e., communication was the fourth one, which implied that instead of the manipulative one-way communication of traditional marketing, organizations should invest in a two-way dialogue between the customer and the company. Therefore, the 4C’s model of the marketing mix came into existence that consists of the following variables: consumer, cost, convenience, and communication.
While on a surface level, the 4P’s and the 4C’s model may look like two sides of the same coin, there is a critical distinction between them; the 4C’s model reflects a change in the overall organizational mindset of viewing their customers as more than just an unspeaking and unthinking audience. 4C’s model encourages an overhaul in the traditional marketing process and value chain and urges marketers to view everything from a customer’s point of view. The model diverts action towards niche marketing, where the conversation is often one-to-one between customers and companies, and a more significant effort is put into understanding just what it is that customers truly want. This entails a thorough knowledge of the market a company wishes to target and come up with solutions designed to be optimal for both the organization and the customer.
In understanding the 4C’s model, one would do well to look into them in juxtaposition to the 4P’s model of the marketing mix. After all, it would be in the best interests of the marketer to consider both the customer’s and the organization’s point of view for creating effective marketing strategies.
The 4C’s of the Marketing Mix

Consumer vs. Product

Modern marketing tactics encourage marketers to focus on selling only that which customers are willing to buy, the information of which is acquired through detailed market research. This is exactly opposite of the previously used traditional marketing tactics of selling just about any product to the general audience regardless of whether the audience desires said product or not.
Sixty-three percent of CEOs see rallying their organizations around the customer as one of the top three investment priorities this year.
For years, businesses took a company first approach to marketing, but over the years, things have changed. With the customer being the king of the market now, companies have wised up and decided its a better idea to first ask the customer what they need to provide better experiences that lead to more customer loyalty.

Cost vs. Price

By definition, price is the amount of money that a consumer is willing to pay to acquire a good or service. Cost, on the other hand, is the sum of the value of all inputs to the production of said good or service such as land, labor, capital, and enterprise. Other factors, like the cost of time to acquire the product, the cost of conscience of consuming the product, the cost to change to a new product, the total cost of ownership, and the opportunity cost of not selecting an alternative, are also included in the cost of an offering.

Communication vs. Promotion

Lauterborn considered promotion to be a manipulative means of selling to an audience, without taking into account any feedback received in return. He emphasized having a two-way means of communication between the customer and the company. This approach encourages dialogues and feedback. It takes into account customers’ opinions on what they would prefer and what would satisfy them. This type of communication improves brand loyalty and sales for an organization and provides in-depth knowledge about their consumer base.
Eighty-six percent of respondents to a Harris Interactive survey said they would pay more if they could guarantee superior service. Eighty-nine percent of respondents who had recently switched from a business to its competitor did so because of poor service.

Convenience vs. Place

Thanks to the technological advancements, customers have no reason to physically seek out a location to meet their needs — they don’t even have to when there are endless options available online. The digital era requires a marketer to be aware of the current trends regarding the changing retail landscape and how to keep up with the customers to be able to cater to them in the means most convenient.

Summing-up

When it comes to creating a perfect marketing strategy, nothing’s a hit or a miss as long as something new is learned out of the experience. However, to save time and money, it’s wise to target the tech-savvy customers of today by making use of the 4C’s marketing model which provides a more customer-centric approach to drafting a marketing strategy that revolves primarily around customers and their needs.

Tuesday, August 13, 2019

Social Strategy articles


  • https://blog.hootsuite.com/how-to-create-a-social-media-marketing-plan/
  • https://www.smartinsights.com/social-media-marketing/social-media-strategy/creating-social-media-content-strategy-plan/
  • https://www.i-scoop.eu/content-marketing/social-content/
  • https://blog.markgrowth.com/how-to-establish-a-social-media-marketing-content-strategy-that-actually-works-5263f0250e86
  • https://www.lyfemarketing.com/blog/social-media-content-strategy/
  • https://buffer.com/library/social-media-marketing-strategy
  • https://wearesculpt.com/blog/social-media-strategy-framework/ ( REALLY GOOD)


Social Marketers Still Aren’t Giving the People What They Want

link to article

Social Marketers Still Aren’t Giving the People What They Want

Sprout Social found a disconnect between brand priorities and consumer desires

Consumers aren't getting what they want from brands' social marketing efforts.
Getty Images
What brands believe consumers want from them on social media doesn’t quite line up with what consumers actually want from them on social media, according to the Sprout Social Index 2018, a new study from social media management tool Sprout Social.
The company asked more than 2,000 social marketers about their approach to “structure, goals and content,” and it then cross-referenced their answers against input from consumers.
Sprout found that the top three priorities for social marketers are posts that teach something (61 percent), posts that tell a story (58 percent) and posts that inspire (53 percent).
Meanwhile, the top three things that consumers are looking for are discounts or sales (72 percent), posts that showcase new products or services (60 percent) and posts that teach something (59 percent).
Sprout wrote, “The sole overlap between top marketing priorities and consumer preferences is posts that teach. If you aren’t already, meet consumers in this sweet spot in the consideration stage. This content takes consumers a step beyond knowing who you are, to knowing what you do and what space you are a part of or an expert in.”
Other content-related findings from Sprout Social Index 2018 included:
  • Consumers are 13 percent more likely to engage with entertaining brand content than to share it with their audiences.
  • Consumers are equally likely to engage with and share inspirational content.
  • Consumers are 31 percent more likely to engage with storytelling content than to share it.
  • Consumers are 24 percent more likely to engage with promotions and deals than to share them.
  • Consumers are 150 percent more likely to engage with employee advocacy posts than to share them.
  • Consumers are 90 percent more likely to engage with posts that showcase company personality and announce company happenings than they are to share them with friends on social.
  • Consumers are 50 percent more likely to engage with posts showcasing new products and offerings than to share them.
The company also found that the No. 1 challenge for social marketers is measuring return on investment, with 55 percent of them citing it, well ahead of the rest of the top five: understanding cross-channel social success (42 percent), developing a strategy to support business goals (39 percent), determining what content to post (27 percent) and securing budget and resources (25 percent).
Customer service came up quite often in Sprout’s research. The company found that 88 percent of social marketers understand the importance of customer service via social media, and 45 percent of consumers had reached out to companies via social media.
For those consumers, 57 percent had questions for the company, 45 percent had issues with products or services and 34 percent wanted to commend the company on their product or service.
“When a customer reaches out with a question—their No. 1 reason for reaching out on social—use this as an opportunity to form a relationship, not just resolve an issue,” Sprout wrote.
The survey found that customer care on social not only contributes to brand perception, but also impacts a company’s bottom line. Twenty-one percent of consumers are more likely to buy from brands they can reach on social, the report noted, and 21 percent said they would rather talk with a brand on social platforms than call.
“This tells us that social customer service has a financial impact and is swiftly becoming the consumer’s preferred care channel,” Sprout continued.
Sprout called employee advocacy “the new influencer marketing,” saying that 71 percent of social marketers currently use employees as influencers or advocates or want to do so in the future, while only 19 percent had budgets for influencer marketing programs.
On the consumer side, 61 percent said they would be more likely to research products or services recommended by friends on social channels, compared with just 36 percent for plugs from influencers or celebrities.
Despite the clear importance of social media to brands’ marketing efforts, more than one-half of social marketers told Sprout they did not have access to all of the software they needed, and 65 percent expressed the need for dedicated resources for content development.
When it came to which social channels they focused on, 97 percent of social marketers said Facebook was their most-used and most-useful social network, and 83 percent said they buy ads on Facebook, which is also used by 94 percent of the consumers Sprout spoke with.
In a bit of a surprise, Instagram dominated Snapchat among respondents to Sprout’s research, with 83 percent of marketers saying they use the Facebook-owned photo- and video-sharing network, compared with just 13 percent for Snapchat, and 51 percent of consumers using Instagram, versus 30 percent for the messaging application.